Demystifying Epic Games Store Spyware

Over the past few weeks, I've seen a lot of discussion about whether or not the Epic Games' store is spyware. Unfortunately, the "proof" and "research" that has been shared is far from either of those things, and can only be described as an amateurish perspective. To clarify, I'm speaking about the technical analysis that's going around, and will not touch any legalese such ToS, EULA, and so on.
Now, don't get me wrong: I'm not here to hate on the analysis, dunk on poor understanding, or call out those that are, rightfully so, concerned about their privacy. To that same note, I'm not here to defend Epic Games. In the spirit of Mueller: this report does not exonerate Epic Games.
Instead, what I want to do is communicate just how much nuance goes into this type of research. It is very important to be thorough, and conclusions shouldn't be drawn by such high-level assessments. For that reason, I will expand on the research outlined in the Reddit thread, digging into everything on a much more intimate level so that everyone can have a better understanding. I will get pretty technical, but will do my best to put everything in layman's terms.
On the note of thoroughness, we come to why this won't be an exoneration: to say that there's nothing fishy going on would be to do a very, very in-depth analysis of a huge program. That would take hundreds of hours, and I don't have that. As I dig into the existing research, you should begin to understand exactly why this is the case.
Who The Heck are You?
Before we get started, let's talk about why you should trust my analysis. First and foremost, I don't have any bias: I don't play any Epic games, I hold no assets associated with them, and I have no interest in the current battle of exclusives going on between game stores. I also have no reason to dislike them.
In terms of credentials, I actually wrote the book on hacking games. Additionally, I have professionally worked on antivirus software for over 6 years and have an intimate understanding of malware analysis, malware detection, and reverse engineering.
Related posts
Before getting started, I want to point this out.
This is a pretty good analysis of the situation, but it's not perfect. This claim is wrong:
This isn't EGS enumerating processes, this is literally how tools like Procmon and Fiddler work, they have injected themselves into the running process.
Procmon doesn't inject, it intercepts events from inside the Kernel. Essentially, that means it tracks events from within the system's underlying infrastructure, and does not directly cause any behaviors inside of monitored user-mode programs. That means it is EGS doing enumeration, but that's not necessarily a bad thing. We'll get to it.
This is how shared libraries work on Windows, and once again in this example he is showing Fiddler which is something he has injected into EGS, nothing here.
Fiddler also doesn't inject. It works by intercepting network requests. This is the first thing We'll talk about.
Other than that, the post hits the nail on the head. I'm going to avoid overlapping with it except in those parts I've mentioned.
Analysis
We're gonna start slow, but you'll be winded by the end.
DLL Access
One of the claims made is
And why is it trying to access DLLs in the directories of some of my applications
Accompanied with this:
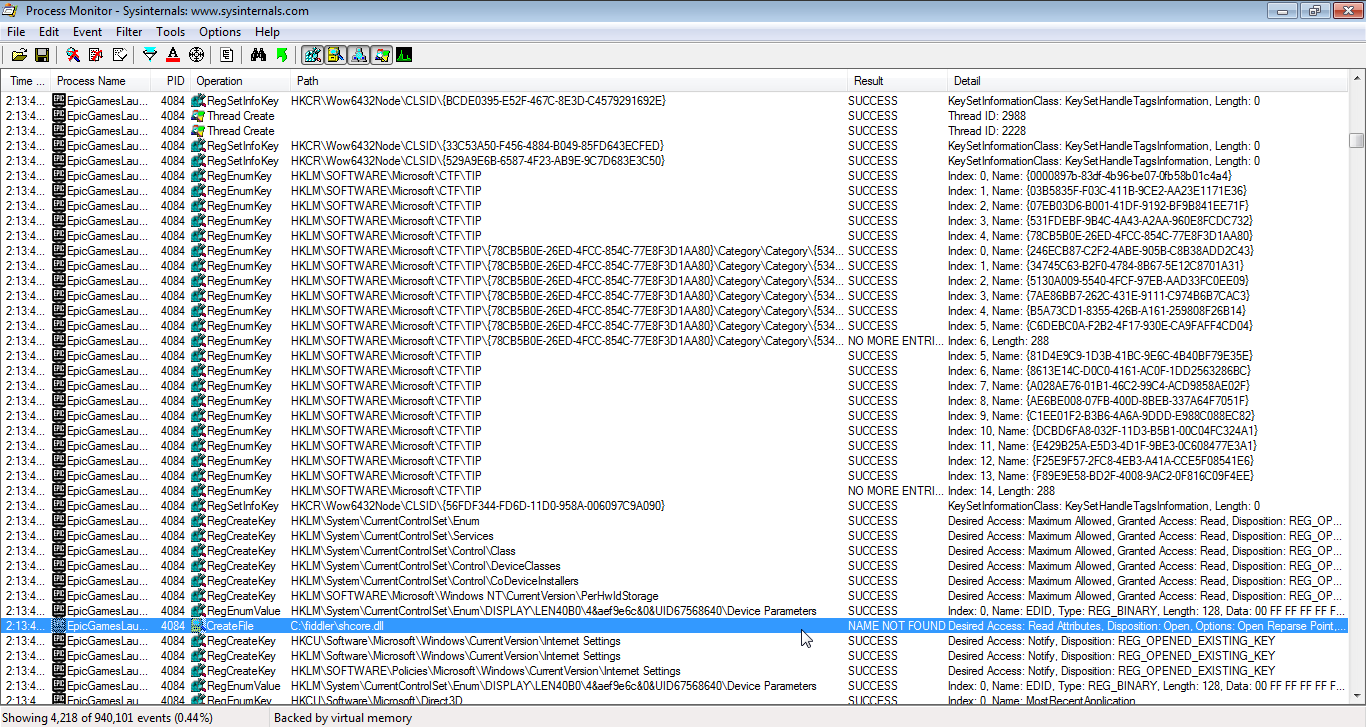
The very first thing to establish is that CreateFile doesn't necessarily create a file. It is simply how you open a file. We can even see Desired Acess: Read, which implies the code is only trying to view the file; this call isn't able to create or modify it. We can also clearly see the result NAME_NOT_FOUND. The file doesn't even exist.
This happened because EGS tried to load a library and Windows was attempting to locate it. Windows looks in various locations when loading executables or libraries. First, it checks in the calling process' working directory. If it's not there, Windows checks every directory in %PATH%, which is an environment variable containing a list of user-specified directories. The directory C:\fiddler\ is clearly in this user's %PATH%, and this event is simply part of the search for Shcore.dll. Yes, it is common for Fiddler to end up in %PATH%.
This person seems to think there is some significance to the Fiddler part of this, since that's an analysis tool he's using. Rest assured, however, it's simply a coincidence. This happens a lot, and we'll see it again with Procmon.
Furthermore, Shcore.dll is a Windows library which assists with high-DPI functionality. Attempting to load this is no reason for concern, and the same is true about pretty much any DLL.
Root Certificates
Another claim is:
More worrying is that it really likes reading about your root certificates
With this:
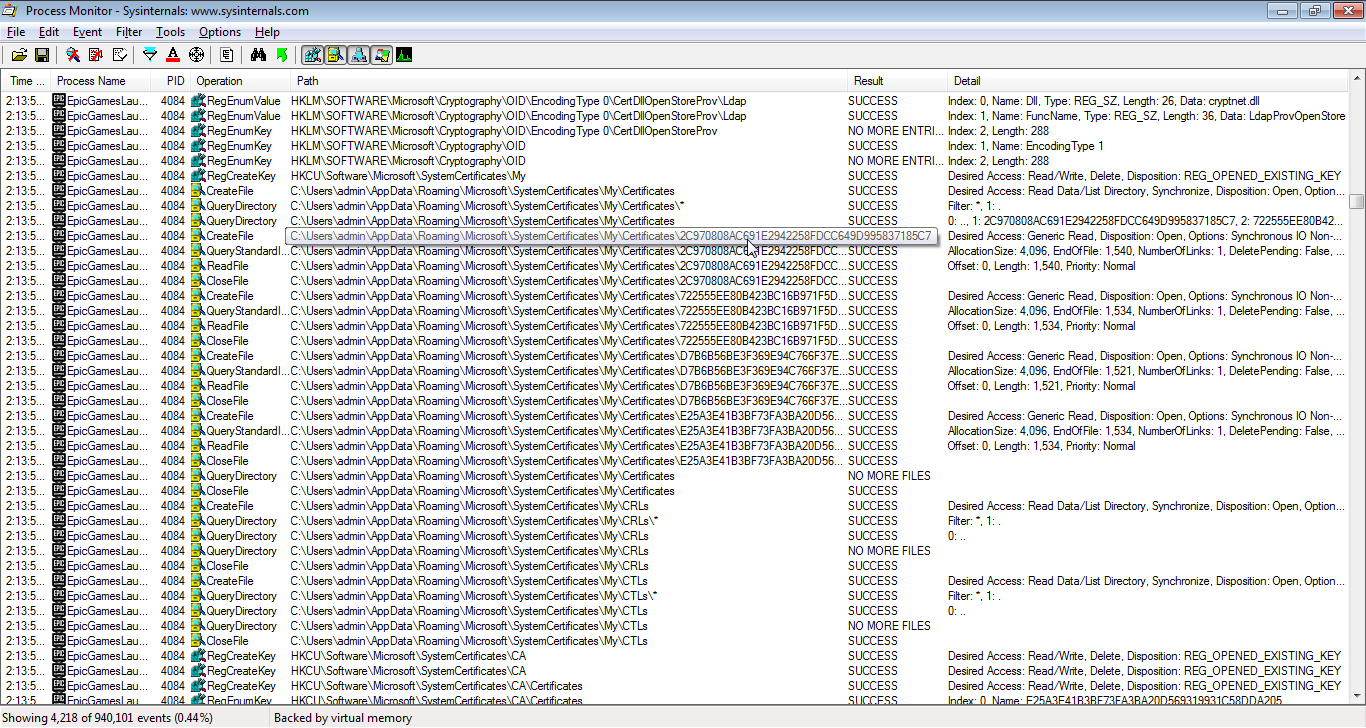
These are used for encryption and security, so surely this is sketchy, right? Actually, no. Let's talk about encryption.
Note: this explanation is only in reference to HTTPS, which is a primarily Browser-based protocol.
Secure communications are carried in part using asymmetric cryptography. This is a type of cryptography where there are two keys: a public key and a private key. The private key is only known to the server. Messages can be encrypted with this private key, and then decrypted by anybody with the public key. These keys aren't actually used to transfer data, though; symmetric cryptography does that. They are, however, used to establish identity before agreeing on a symmetric algorithm and setting up its keys. This identity establishment works because your computer, my computer, and most people's computers contain a list of trusted public keys. Only someone with a private key can generate a valid message for a given public key, and thus the whole system works. Rather than have millions of trusted keys, though, everything is set up so that we only have to trust a handful of Certificate Authorities. With their private keys, they can mark a public key as trustworthy, thus creating a chain of trust. It's a bit more complicated than this, but not much.
Knowing this, we can reasonably say that accessing the certificate store is a good thing. It means an application is validating who it is talking to and properly encrypting messages. This behavior exists in all modern browsers, and we can see that a browser is actually what's causing this:
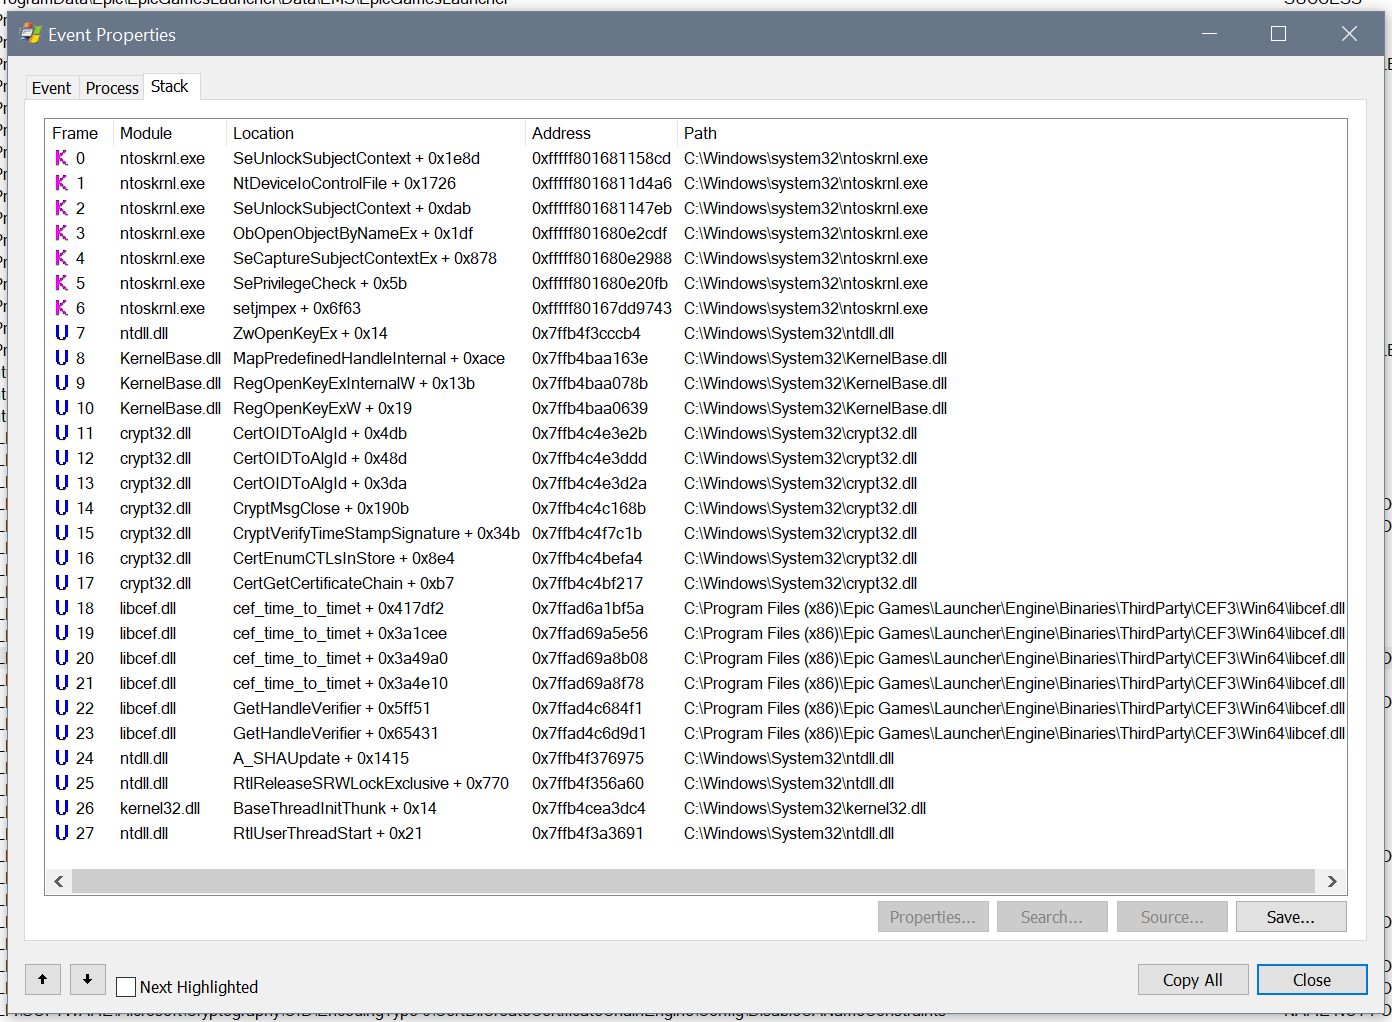
Without getting into too much detail right now (don't you worry, we're gonna discuss exactly what this is later), this shows that the certificate events are happening through libcef.dll. That is CEF, the Chromium Embedded Framework, a library that can be used to embed a Chrome browser frame inside of an application. Epic is using this to have a portion of their UI deployed as a website. We can also see that the certificate store isn't even directly accessed by CEF. Instead, it is accessed by crypt32.dll, which is a Windows library for doing all sorts of cryptography.
Remember kids, cryptography is a good thing.
Talking to Oneself
Claim:
In my totally professional opinion, the EGS client appears to have a severe mental disorder, as it loves talking to itself
I really hope that first bit is sarcasm. It is actually very, very common for applications to talk to themselves like this. This is what we call IPC, or Inter Process Communication. Software is becoming more and more distributed: multiple threads, multiple processes, and multiple machines. Yet these things all must communicate. Because of this, IPC mechanisms have become easy to use, fast, and stable. Even when speaking between threads in the same process, it can be better to use established IPC mechanisms as opposed to developing cross-thread messaging. There's nothing wrong with specializing inter thread communications, but if you have IPC already, there aren't really any disadvantages to repurposing it.
Note: for some reason, nobody calls Inter Thread Communication ITC.
This really demonstrates the naivete of the poster. One tip I have for any aspiring reverse engineers: unless you're a relentless self-skeptic, learn to code first. You can tear apart an engine, but you'll end up confused if you don't know that oil lubricates and gas is combustible.
Tracking
There are various claims about tracking. I agree with them all. But there's some context.
Every. website. tracks you. It's what happens. Every one. It's the accepted standard. For browsers, there are various plugins which can help:
- Ghostery
- Privacy Badger
- Do Not Track
For things like the EGS, you'll need DNS-level blocking.
DNS is effectively the phone book of the Internet. You put in a name, you get a number. Except it's a domain for an IP.
Epic is nice enough to use segregated domains for tracking:
tracking.epicgames.comtracking.unrealengine.com
I use Pi-hole to stop all tracking and ads. It does this by essentially giving an empty response to DNS queries for known trackers and ad networks. Epic isn't on the blacklist by default, but custom blacklists are easy:
Process Enumeration
Strap in.
Let's look at the first claim:
One of the first things I noticed is that EGS likes to enumerate running processes on your computer

Why is it looking at procmon.exe? What is procmon.exe? Procmon is actually the software in the screenshot. It's ubiquitous analysis software used to create event traces.
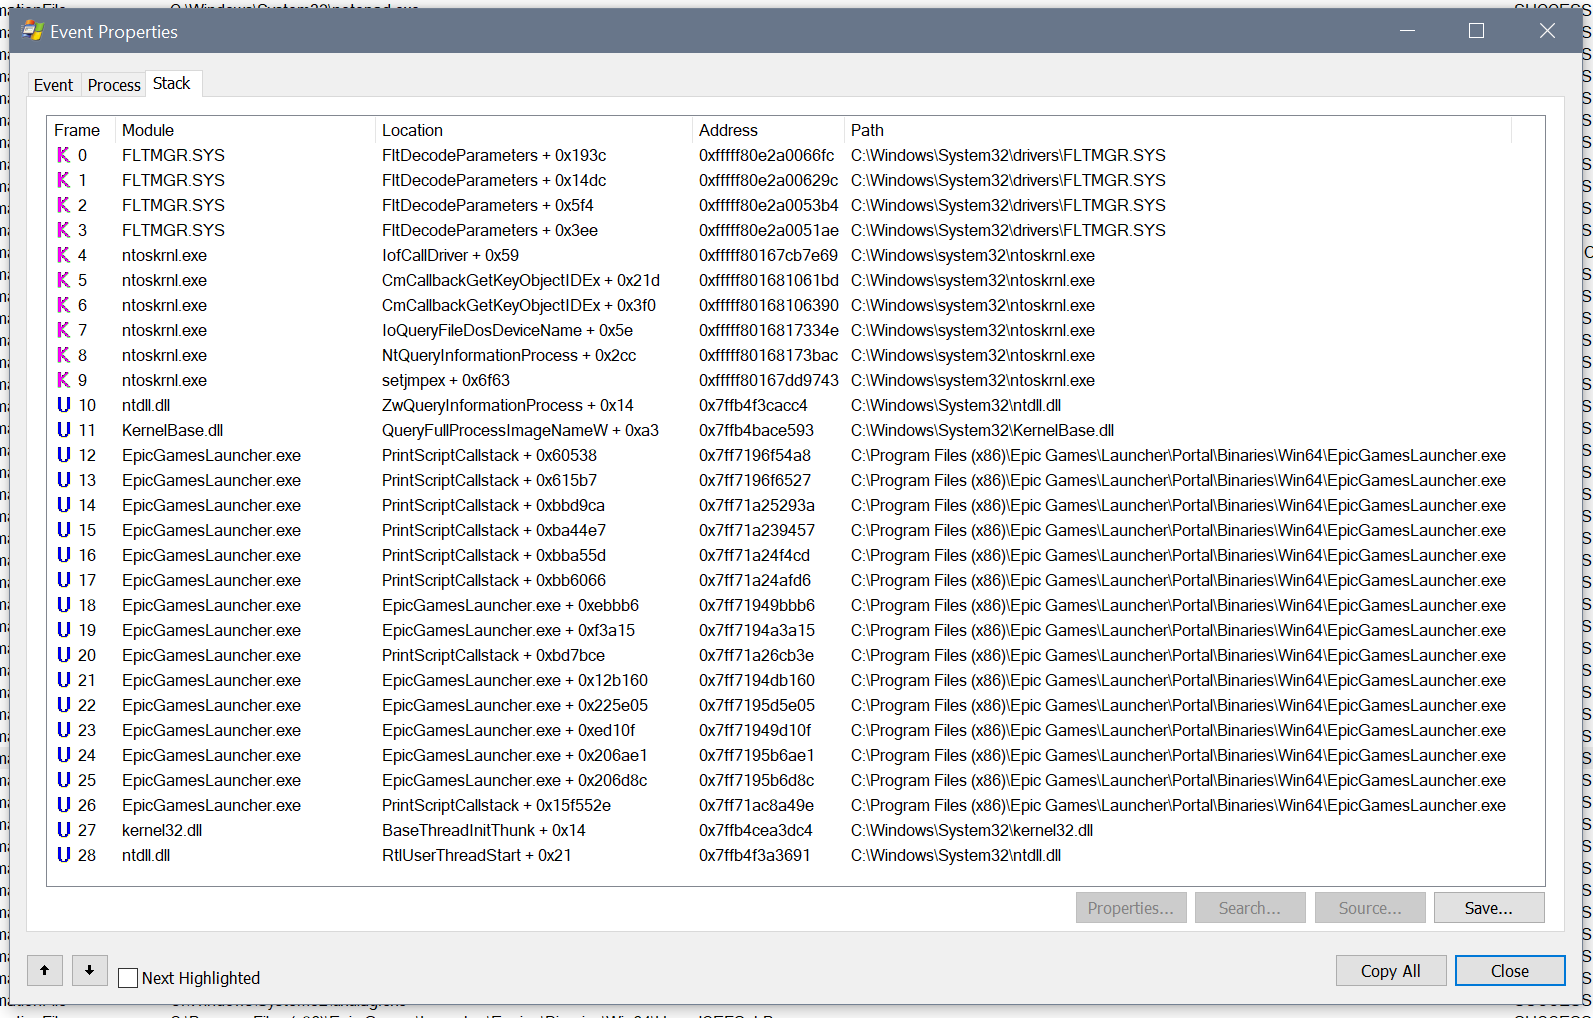
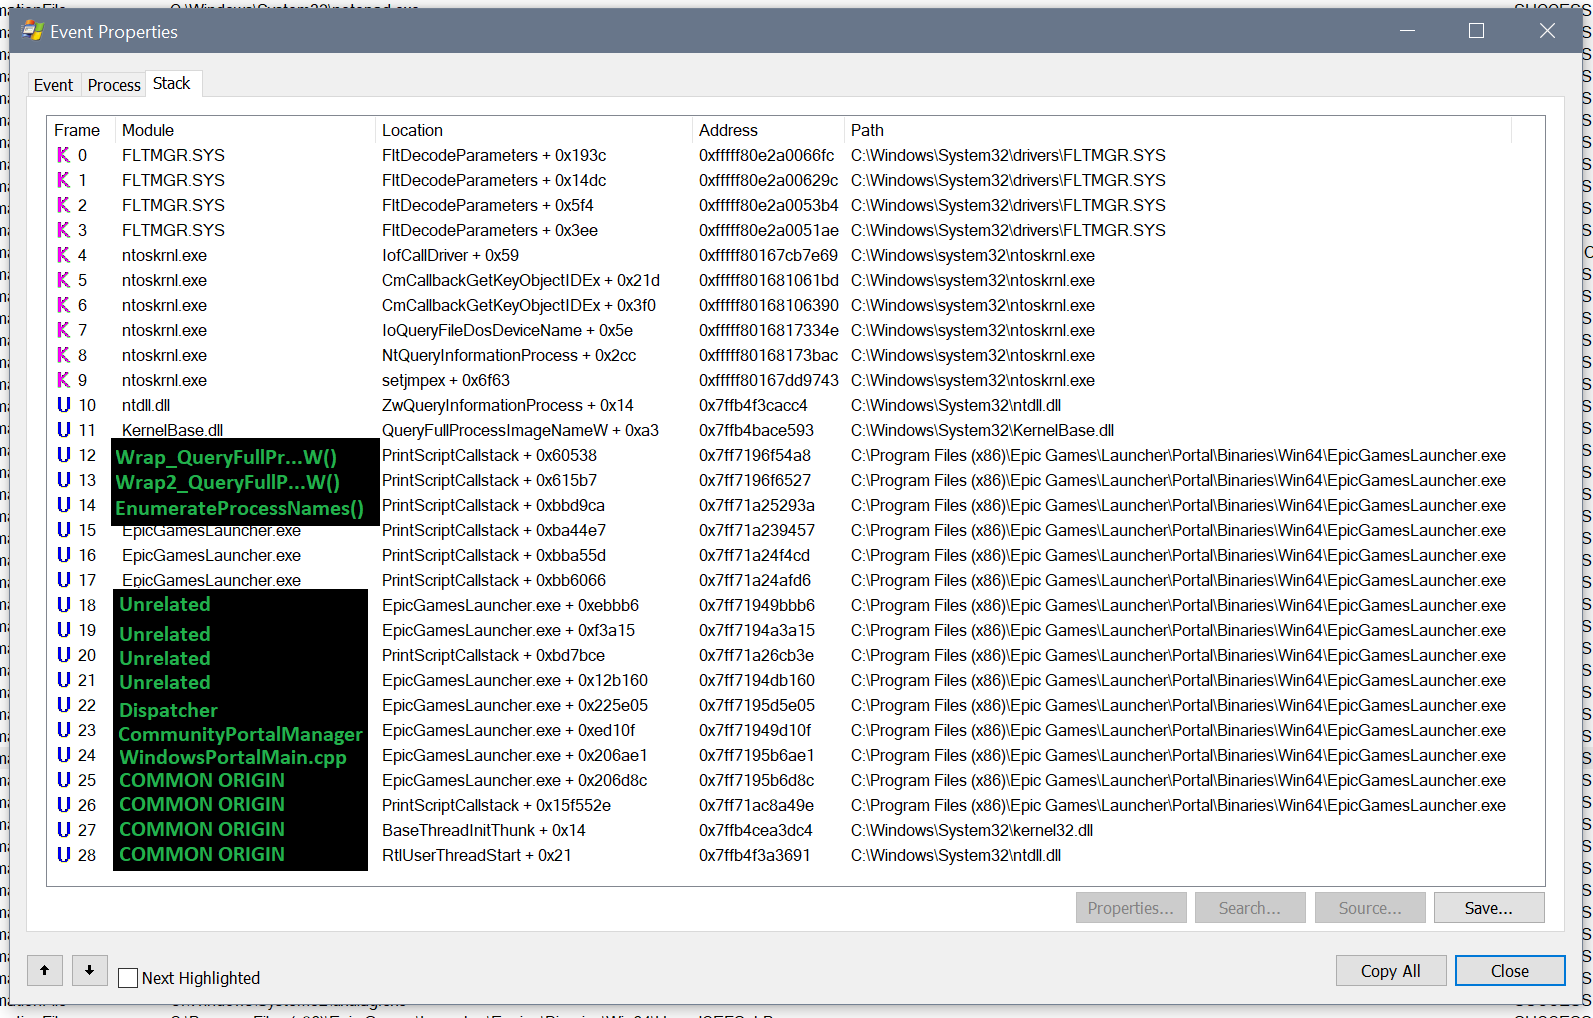
If you don't really know how Windows works under the hood, this prodding of Procmon may seem very sketchy. However, let's dig a bit deeper. If we double-click on an event in Procmon, we get a window with details. Within that window, there is a tab which shows the call stack. This is the chain of functions that lead up to the call being made, and can give us a lot of context:
A call stack is read top to bottom. Imagine Alice wants to know where Bob lives. Alice isn't sure, so she asks Paul, who checks his contacts to get the address. Paul then passes the address back to Alice. If we made a call stack for this event, it might look like this:
0 PaulCheckContacts
1 PaulHandleRequest
2 AliceAskPaul
3 AliceLocateBob
Paul may know a lot of information about Bob, but the only thing ever passed back to Alice is his address; Alice can't really peer into what Paul is doing or seeing without a lot of trickery.
To restate: afterAliceAskPaul, everything is out of Alice's hands. What Paul does is up to him.
Additionally, when we talk about code, we use the word call. In this example, a call would be Alice deciding to ask Paul, then her Asking Paul, and so on. It is the invocation of a function.
In our case, EGS code loses control after frame 12. After that, what happens is up to QueryFullProcessImageNameW(), which is part of Windows. If we look at the documentation, we can get an idea of what's going on:
BOOL QueryFullProcessImageNameW(
  HANDLE hProcess,
  DWORD  dwFlags,
  LPWSTR lpExeName,
  PDWORD lpdwSize
);
Effectively, this says: give QueryFullProcessImageNameW() a process handle (hProcess) and it will give you back the file name (lpExeName). Now things are becoming more clear: EpicGamesLauncher.exe doesn't even know that this is Procmon. That's literally what the code is asking Windows: "I have this process, can you tell me what it is?". All of the other things, including the event in question, are implementation details.
Next, we need to understand why it wants to know the process' name. If we dig into the Procmon trace, we can see that it's actually just looking up the name of every process. It's not targeting a specific process, not at this point. Once again we're left asking a question: why does it want to know the names of all running processes? Believe it or not, this is surprisingly common.
Note: when I say this is common, I mean it. Though it may not seem like it, there are so many reasons why programs do this. It's not a big cause for concern, and can't be leveraged for much value.
I'm still going to dive in to this, but not because I want to prove there's no wrong here. Rather, I think it's a good way to illustrate what analysis actually looks like. A good way to show that you can't just take a Procmon trace at face value.
Let's dig deeper. At frame 12, we see that the process scan is happening at PrintScriptCallstack + 0x60538. It may be tempting to assume that the code is printing some call stack of it's own, but that name is just a coincidence. The offset of 0x60538 is quite important. The number is quite large, which means the real code is unlikely to be a part of the function PrintScriptCallstack(). Instead, PrintScriptCallstack() is simply the nearest meaningful reference point that Procmon had for the code.
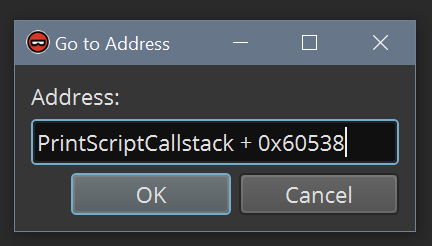
Using a tool called Binary Ninja, we can inspect this code:
Except in certain cases, you don't ever get the actual code of a program running on your computer. Instead, you get what is called assembly code. This is the result of a compiler taking human-readable-and-writable code and transforming it into something a computer can execute. Thus, if we want to analyze this program, we use a tool like Binary Ninja to disassemble the machine code.
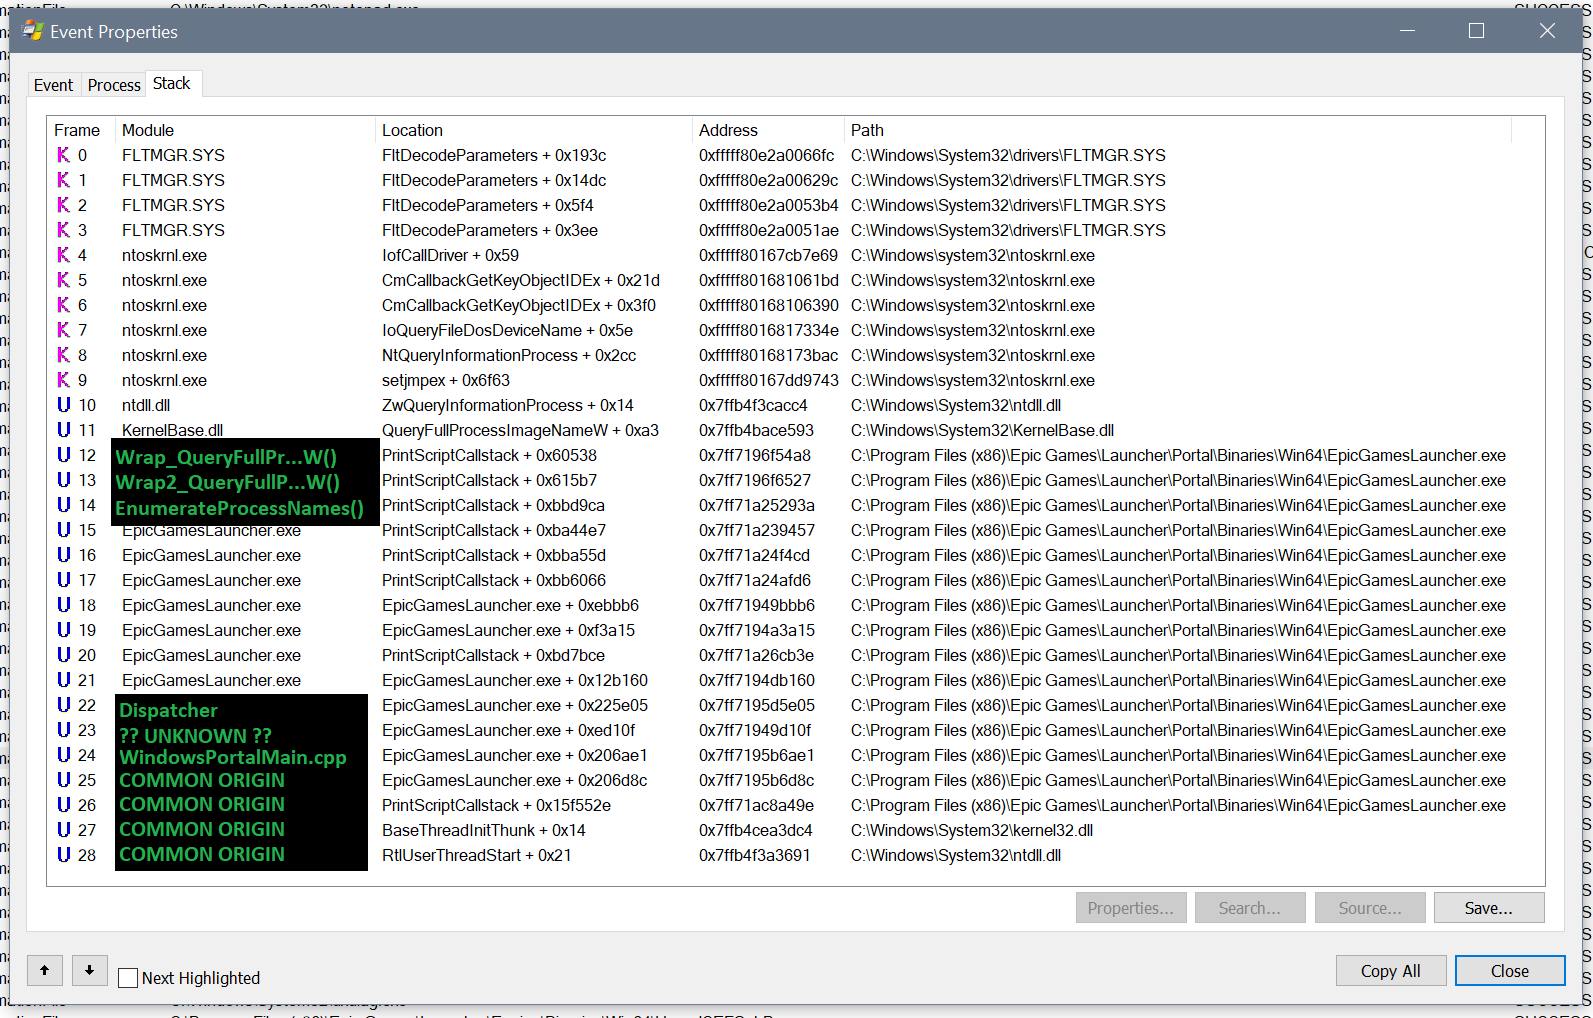
Upon inspection, we find ourselves inside of a function which appears to be what we call a wrapper. Effectively, the code just calls QueryFullProcessImageNameW(), takes the output, and puts it in a form which is more usable by the rest of the code. We'll call this wrapper Wrap_QueryFullProcessImageNameW().
And once again, we don't have the answer to our question. We need to go one level above the wrapper—frame 13 PrintScriptCallstack + 0x615b7—to get more context. And, once again, we hit a wrapper that we'll call Wrap2_QueryFullProcessImageNameW(). If we move on to PrintScriptCallstack + 0xbbd9ca, seen in frame 14, we finally get somewhere! The function—let's call it EnumerateProcessNames()—is quite complex, calling out to dozens of other functions while executing loops and if-statements all over the place.
To blog a complete analysis of this would be quite the undertaking, so I'm going to give the cliff notes.
- This is a very common type of process loop, using the standard Windows functions
Process32First()andProcess32Next() - This doesn't appear to be looking for any specific process, because the loop will continue until it has seen all processes and will not exit due to any other conditions
- We see various strings (this is what we call text) in the function which point to it being part of Unreal Engine; e.g.
Attempting to use a container element...
And if we check the released code for Unreal Engine, made by Epic Games, we can find a function which matches all of the strings perfectly:
FORCEINLINE void CheckAddress(const ElementType* Addr) const
{
	checkf(Addr < GetData() || Addr >= (GetData() + ArrayMax), TEXT("Attempting to use a container element (%p) which already comes from the container being modified (%p, ArrayMax: %d, ArrayNum: %d, SizeofElement: %d)!"), Addr, GetData(), ArrayMax, ArrayNum, sizeof(ElementType));
}
However, this is only a subset of the offending code. The FORCEINLINE specifier is responsible for that; it tells the compiler: "instead of generating a call into this function, place the code of this function inline with the function that is using it". This code comes from a bigger piece of code for managing an array, which is essentially a list of things.
We still don't know what the offending code's purpose is, but we can now give a summary of it's behavior: iterate over every process. on each iteration, lookup the process' file name, then store it in an array.
Now we ask what is that array for? Well, it appears it array is returned from EnumerateProcessNames(), much like Bob's address is returned in Paul's answer to Alice. So who is our Alice, and why is she asking?
We could keep moving up frame-by-frame, but let's first demystify the call stack a bit. We can do this by looking at multiple call stacks from multiple events at very different points in the event trace. The only thing these events must have in common is their thread id. A thread is an execution context, a universe in which a piece of code executes. Any code executing in the same thread will have a common origin, each event just being part of a large cascade of function calls all acting as a single unit. Thus, by comparing multiple call stacks on the same thread, we can identify common code as well as points of divergence.
If we go back to our previous thought experiment, we can generalize this. Let's say Alice does a lot of other things throughout her day, and that she does one at a time. Restating: she starts one task, waits for it to finish, and then starts another.
If we made call stacks for all of her tasks, each one would have her at the bottom. As tasks break into sub-tasks, many call stacks would share more and more bottom-most frames in common.
Taking our previous example, let's say Alice also asks Paul for Jim's address. Paul doesn't know, so he asks Tom. Let's put these call stacks side-by-side, aligning them at the bottom:0 TomRecallAddress 1 TomHandleRequest 0 PaulCheckContacts 2 PaulAskTom 1 PaulHandleRequest 3 PaulHandleRequest 2 AliceAskPaul 4 AliceAskPaul 3 AliceLocatePerson 5 AliceLocatePersonEven though the call stacks differ in depth, we can clearly see a common point of origin. Beyond the common origin is the point of divergence.
So, let's take four very different events and compare their call stacks; the event we've been looking at is second from left:
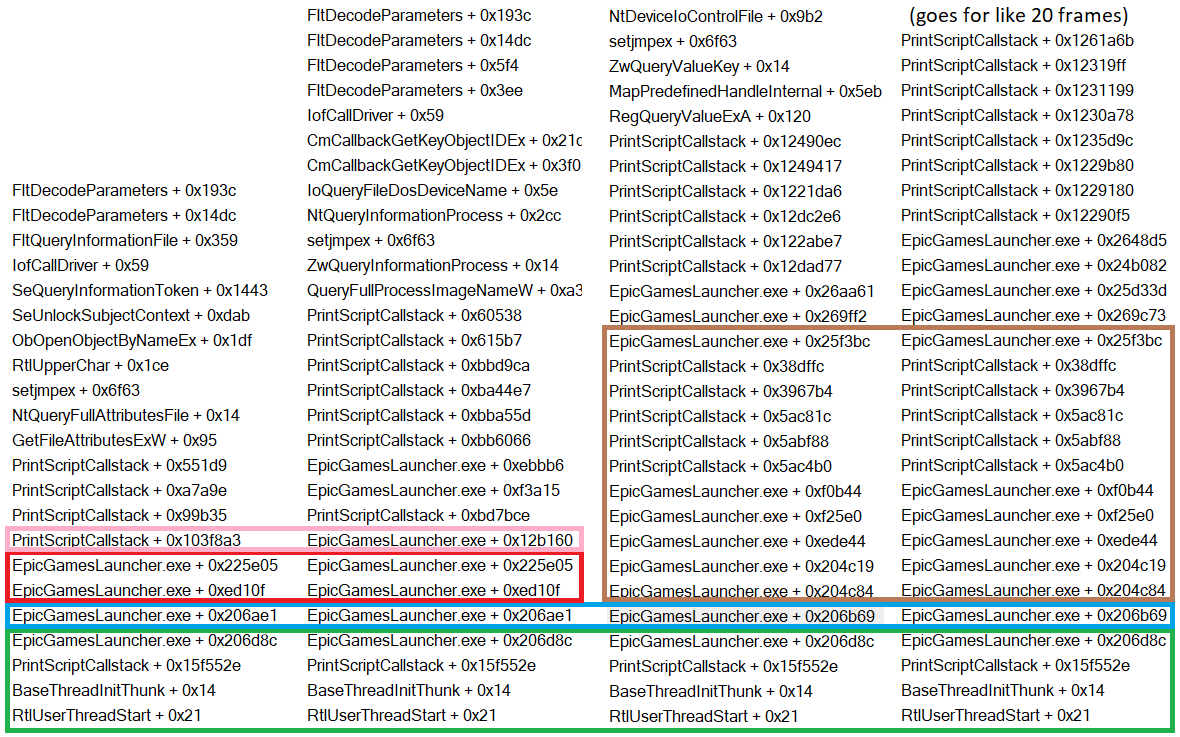
In green, we can see a common origin. This is likely a result of setting up the program and preparing to execute. In blue, we see the first divergence point. The left pair shares offset 0x206ae1 and the right shares 0x206b69. Notice that both start with 0x206, differing only in the three final digits. If we go to either of these offsets in Binary Ninja, we see they are actually a part of the same function. Poking around this function, we see strings referencing WindowsPortalMain.cpp. This tells us that this function resides in C++ code corresponding to the portal's main window. Moreover, it tells us that the code in this thread is likely all related in some way to the user interface, and the divergence we see might relate to different UI elements.
In red, we see another common branch, with the divergence point in pink. The offsets at divergence are wildly different this time around. We would expect to diverge in similar code, as we saw before, so this is interesting. If we look at the code, we can see why:
Normally, functions are called directly. In this case, however, the function is looked up from some value stored at rax+0x38. Tracing backwards, we can see more code related to arrays. We can also see that this all happens in a fat loop.
Without digging too deep, we can summarize what's happening:
- The program has an array with multiple things
- Each thing has some specific function stored
0x38bytes into it's memory - The program iterates over each thing (using
raxto reference a thing) - Within each iteration, the function stored
0x38bytes into a thing is called
Or: this part of the program is responsible for executing various different tasks; the task we're trying to unravel is one of them. For simplicity, let's call this frame Dispatcher.
At this point, we can draw two important conclusions from the act of comparing these stacks:
- Anything specific to the process name enumeration will happen at frame 21 and above
- Anything below this is more big-picture
Here's the original stack, now annotated:
Okay, so we're missing part of the big picture in frame 23. It may seem counterintuitive to dissect it, since we know it's not specific to the process-related code, but let's do it anyways. If we jump to it in Binary Ninja and look around, we'll find code referencing this string:
CommunityPortalManagerSingleton.h. That's interesting, let's make a note of that.
At this point, we know what most of the 28 frames are doing. It's frames 15-21 that are still a mystery.
To dig deeper, we need to start dynamic analysis, which we'll do with x64dbg. Like Binary Ninja, this will give us access to the program's assembly code. In addition, however, it allows us to debug the process. This means we can breakpoint function calls, look at memory, and more.
Imagine a debugger as a third-party, let's call him Nick. At any point, Nick can interrupt Alice, Paul, or Jim to ask what they're doing, what they're thinking about, what they're going to do next, and so on.
Interrupting someone is called a breakpoint, we say it is hit when the interruption happens. By inspecting memory, registers, and assembly code while a breakpoint is hit, we can figure out what the code is thinking and what it'll do next.
We still have some frames to demystify. Let's set breakpoints on each of them, restart the program fresh, and let it execute until the topmost frame has been hit. What we see is very telling:
The first obvious thing is that frames 18 and 19 aren't related to process enumeration. They are very busy doing a lot of things, meanwhile process enumeration has only happened once. The second is that frame 20 must have a ton of responsibilities, as it has waited for dozens of calls without having anything returned (implying there's a lot of stuff that has to finish before it is done working). The final takeaway is that frames 15, 16, and 17 are likely closely related, as they are executing in lockstep. This is where we should try to find the actual behavior.
Note: you might wonder why we didn't do this before, why we would have bothered comparing call stacks manually. The answer is simple: it's likely that there would be thousands or tens of thousands of hits if we dropped breakpoints on every frame.
The stack comparisons let us narrow down the scope by a lot so that this method would be more manageable.
Here's a newly annotated call stack:
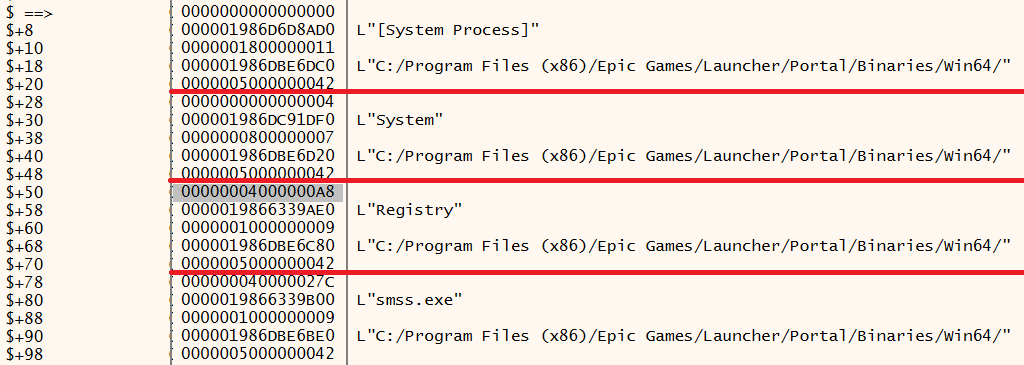
Now, let's drop a breakpoint on frame 15. This will be hit right when EnumerateProcessNames() is complete. If we inspect the memory, we can confirm that it does indeed return an array of process names:
That shows the first 4 entries. One peculiar thing is that the path is always of the EGS folder, not of the process in question. It's repeated over and over, full copies of this string.
I spent a lot of time trying to get the next loop to do something. The first time this all happens, it gets bypassed completely. In subsequent executions, it seems to be comparing the new process list to the previous one; some sort of merge or dedupe. There are many statements which follow the loop that won't execute, even when patching values in. If I'm being honest, I think it might have something to do with that potential bug; this code might actually not be working properly because of it.
You may have noticed that I said subsequent lists are compared to their predecessors, and that may make you think "oh, so they're storing it!". While they are, it doesn't seem to be consequential. I tried a lot of memory debugging techniques to see what other code could be touching the values and I came up completely dry. I've kinda broken stride at this point because I hit the part of reversing where I had to follow a lot of rabbit holes, most of which didn't pan out. I did eventually try setting a memory breakpoint on the path, rather than the process name, and that actually got me somewhere.
Back to our running thought experiment, a memory breakpoint is if Nick could say "let me know when you think about X" and anybody in the universe would tell him and allow him to interact with them before continuing.
Look, computers are weird. Not all of the analogies can make sense.
By somewhere, I mean here:
This is calling a function which does case-insensitive string comparison. That is to say: it compares two pieces of text, ignoring case. The strings to check are passed along in two registers, and we can see them clearly:
If we drop a breakpoint on this call and watch what comes through, we will see that the strings are always the same. Well, not actually. The first string is always a different copy of the same string, and we can see that because the number beside RCX changes while the text remains the same. Why is it a copy? Because this comparison is made against every single path in the process list to see if any of them are C:/Program Files/Epic Games/Fortnite. Except they will never be, because they are always the same wrong path. I told you it's a bug. It also appears that this is invoked via a chain of calls originating from frame 17, confirming that it's happening soon after the enumeration.
Incase you don't follow, let's summarize what we know:
- This thread handles the user interface
- If we had to summarize the big-picture of what the main bit is, it's Windows Portal
- A layer down from that, we get Community Portal
- After a bunch of layers of unrelated stuff, we end up in code which enumerates a process list
- The enumerated processes are searched to check if any of them happen to be in the Fortnite folder
That seems pretty innocuous. If we forget about the fact that the code doesn't seem to be working properly, we can come up with all sorts of reasonable explanations for why Epic might want to know if Fortnite is running. Possibly to display something in their community portal user interface? Now doesn't that just sound like almost any game store you've seen?
Of course, we could dig deeper and deeper and deeper to ABSOLUTELY PROVE THERE'S NOTHING MALICIOUS. But that would be stupid. All of the complexity here comes from well-written code abstractions. When that is compiled down, however, it makes it difficult to reverse engineer without a ton of work. I'm not going to do that, cause I'm not completely stupid. If EGS was doing something sketchy with this list—and there's not a lot of sketchy to be done—there are a million underhanded ways to hide it that are easier than building the functionality up into a conglomerate of classes, virtual functions, custom allocators, thread safety mechanisms, and dispatchers.
And that's a wrap. Go get a snack, you've earned it.
Conclusion
Software is extremely complicated. In some cases, that complication means it's easy to misjudge things that you don't quite understand. In others, it means you can't judge things without putting in a ton of effort.
I hope this gives you a healthy skepticism for the next time you encounter a vague, knee-jerk hot-take about a piece of software.
I feel like I should write something else here, but I'm already at 5,000 words and really don't feel like it. Thanks for reading!

